
Issue #483
This special edition of Now Taking the Field is an update of similar write-ups I’ve done the past few years. I’ve added in the data from the 2025 season, and made some tweaks to the narrative for each graph.
For this analysis I'm going to be looking at rate statistics, so that shortened seasons like 1981, 1994, 1995, and 2020 can be included, and we can also compare trends going far back, before the current 162-game schedule was established. So by “rate”, all numbers in this article are stats "per team, per game," and are obtained from Baseball Reference—see these batting, pitching, and fielding tables.
I’ve created the charts in this article myself, with the first one (HR) going back to 1871. The others go back to 1901, because some numbers were extremely different prior to that start of "modern baseball," and in some cases we lack the statistics altogether. (Note: the totals used here for "major leagues" now also include the various negro leagues that were recognized as having "major league" status.) The statistics included below are: HR, Runs, ERA, Batting Average, Stolen Bases, Caught Stealing, Triples, Sac Bunts, Strikeouts, Complete Games, Errors, and Catcher Passed Balls.
Home Runs

HR rates dating back to 1871
In 2024 there were 1.16 HR per team, per game—a bit more than than the 1.12 HR rate we saw in 2024, but less than the 1.21 HR rate from 2023. I’ve labelled in the chart above various relative highs and lows for HR going back all the way to 1871. Yes, the PED era saw an uptick in HR as compared with the 1970s and 1980s. But since then the use of advanced analytics, and especially the focus on launch angle and exit velocity, has led to more and more HRs being hit overall, with a record set in 2019 of 1.39 HR per team, per game.
Runs

Runs scored per team, per game dating back to 1901
As shown above, the level of runs scored per team, per game has fluctuated a lot over the years since 1901. The average across all 30 teams in 2024 was 4.45, higher than the 4.39 rate in 2024, but less than several other recent seasons. And the 2025 average is dramatically lower than the recent high of 5.14 in 2000, and the all-time high in 5.49 in 1930. But it remains well above many seasons from the 1960s and 1970s, including of course the 1968 “Year of the Pitcher” which saw a paltry 3.42 runs scored per team, per game.
Earned Run Average
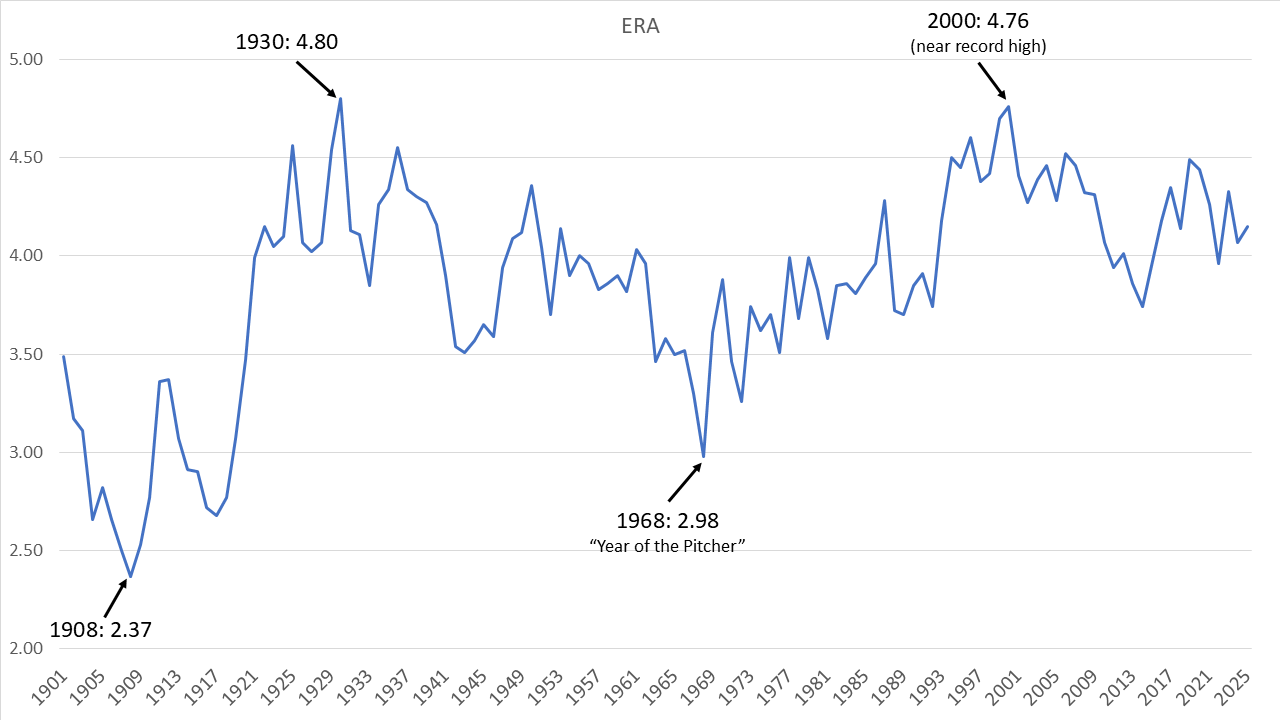
Average ERA per season, dating back to 1901
Closely related to total runs scored is of course pitching ERA (not all runs are “earned", but as you can see from the chart above, the historical graph here has similar highs and lows.) In 2025 the average ERA across all 30 teams was 4.15, up a bit from 2024 (4.07), but lower than the 4.33 mark from 2023.
Batting Average
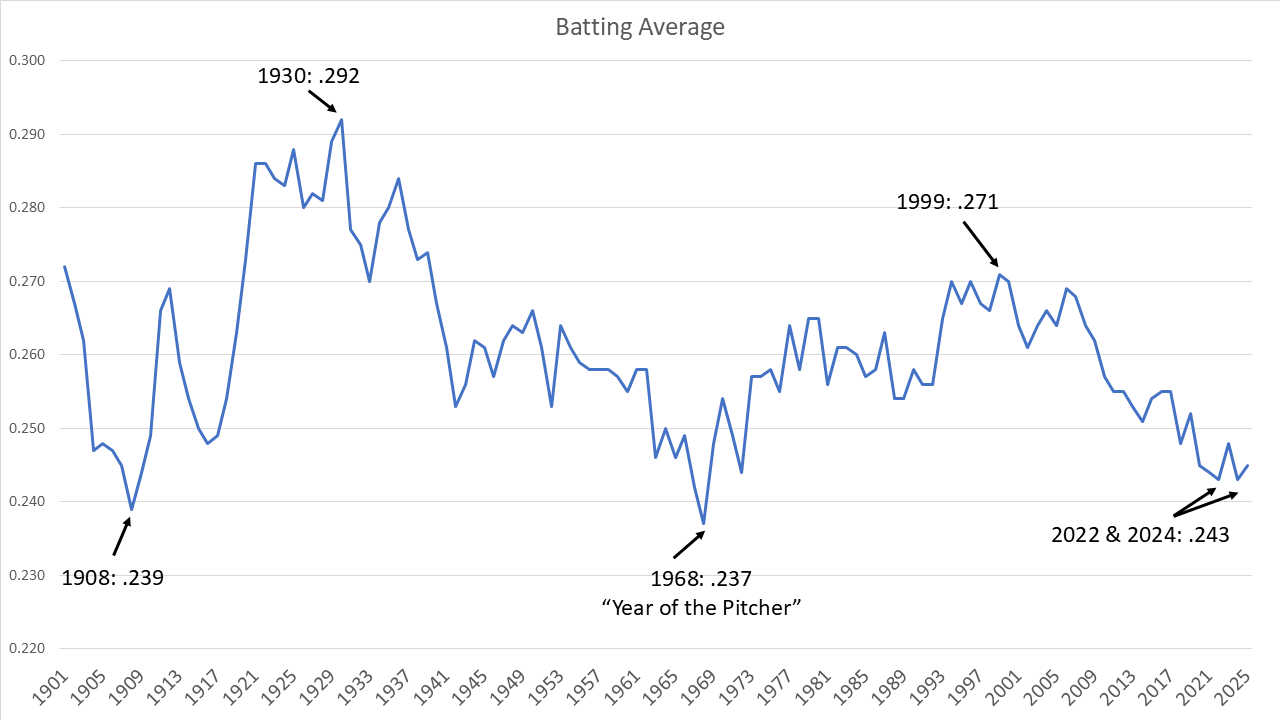
Cumulative batting average per season, since 1901
While no longer as revered as it once was, most baseball fans still track batting average with some interest. As shown above, we’ve seen a decline in overall batting average since the early 2000s, with 2025 coming in at .245, just ticks above the .243 mark from both 2024 and 2022, but below the .248 average from 2023. Yes, there have been a few lower seasons throughout MLB history, such as .237 in 1968 and .239 in 1908. But it is also worth noting that the majors had an overall average of .270 or higher every year from 1920-1939, and an overall average of .260 or higher every year from 1993-2009.
And as I’ve frequently noted, its not just the overall batting average that is low these days. The leaders the past two years have not been very high either, with Aaron Judge at .331 in 2025 and Bobby Witt Jr. at .332 in 2024. In both seasons, only seven batters with enough qualifying plate appearances hit .300 or higher, similar to the low total of six who did so in 1968.
Stolen Bases
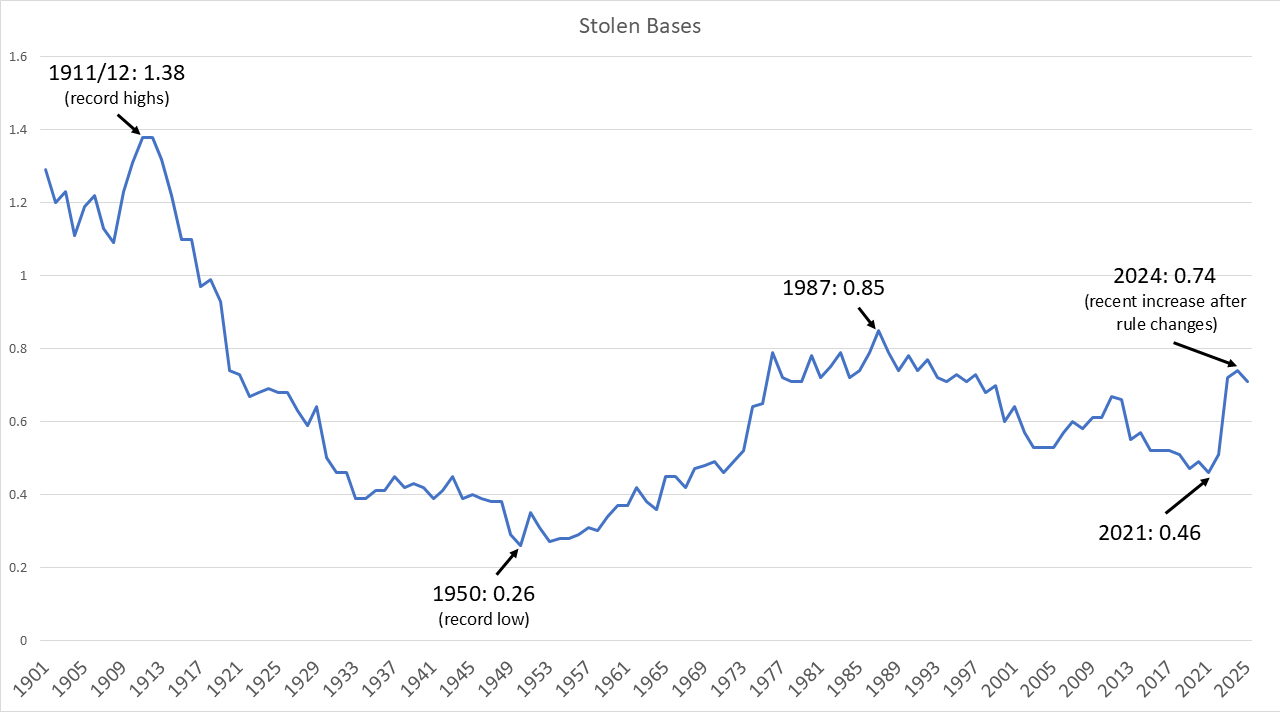
Average stolen bases per team, per game rate, since 1901
The trend towards fewer and fewer stolen bases does appear to be over, as the uptick we saw in 2022 turned into a surge in 2023, and then we seem to have reached a new normal these past three years. In 2025 we saw 0.71 SB per team, per game—nearly as many as the 0.74 SB in 2024 and the 0.72 SB in 2023. What felt like a trend that might lead us back to the very low SB numbers we saw in the 1950s now seems to have been reversed. The big reasons for this of course are the rule changes, such as how often pitchers can throw over to first base, and the increased size of the bases themselves.
Another factor is that the overall caught-stealing % for catchers dropped rather dramatically in 2023 to an all-time low of 19.8%, before recovering a bit to 21.0% in 2024 and 22.3% in 2025 (still the second and third all-time lowest rates.)
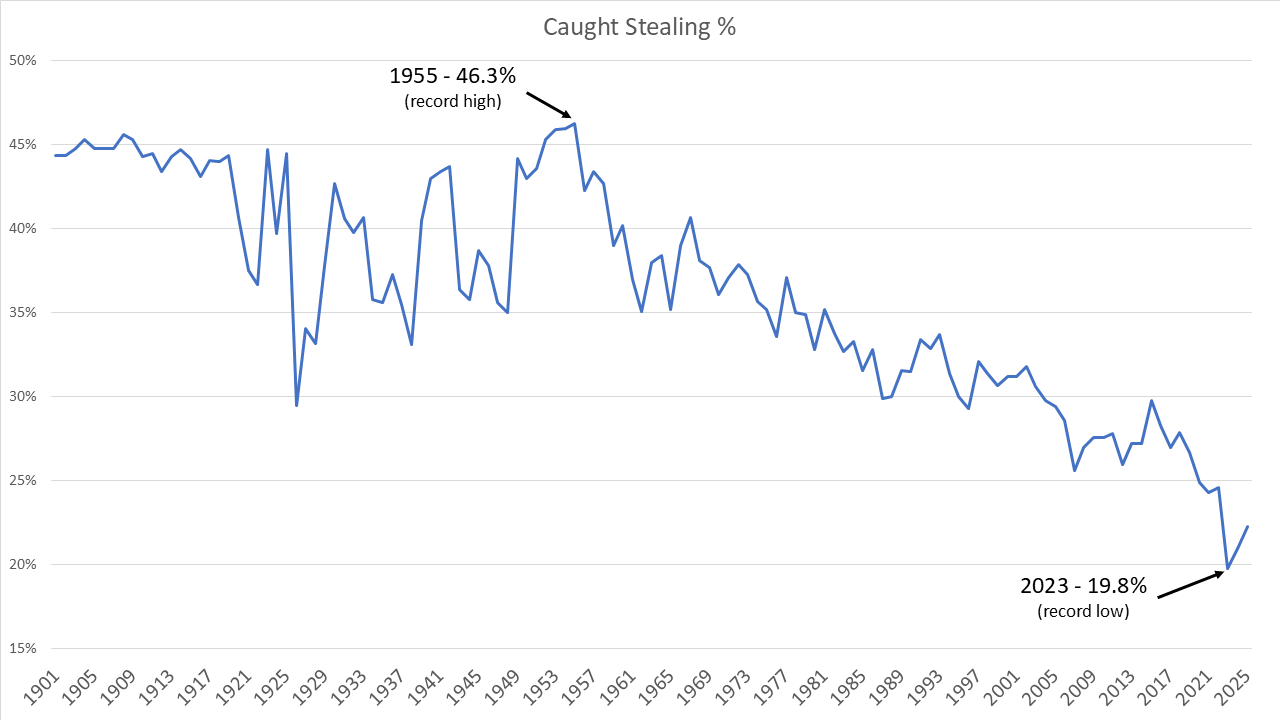
Caught Stealing % for catchers
Triples
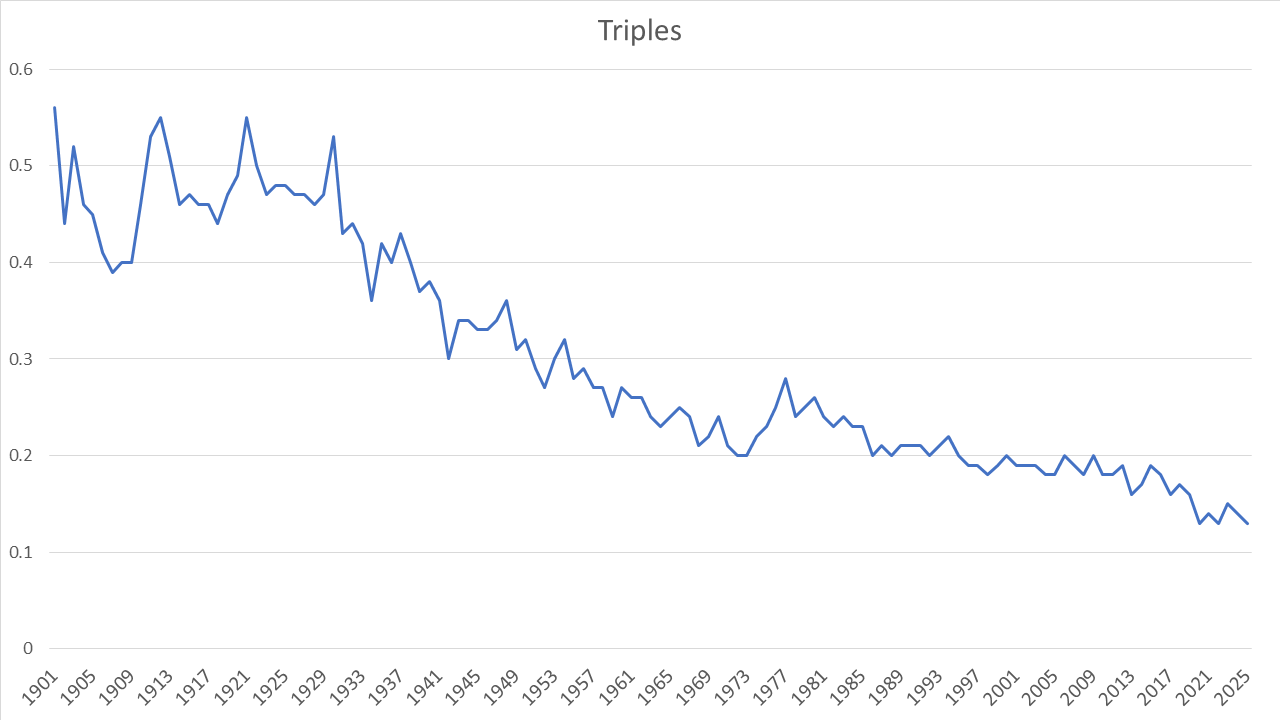
Triples rate, per team per game, since 1901
Serious baseball fans know that there used to be a lot more triples hit by batters—especially in the era before Babe Ruth led the surge in HR. As the chart above shows, we are essentially at the end of a longstanding trend downwards. For fans of triples, in 2024 we did had four players with 10+ triples for the first time since 2019. And then in 2025 we had five such players, with Corbin Carroll leading with 17—the most since José Reyes had 19 in 2008.
Sacrifice Bunts
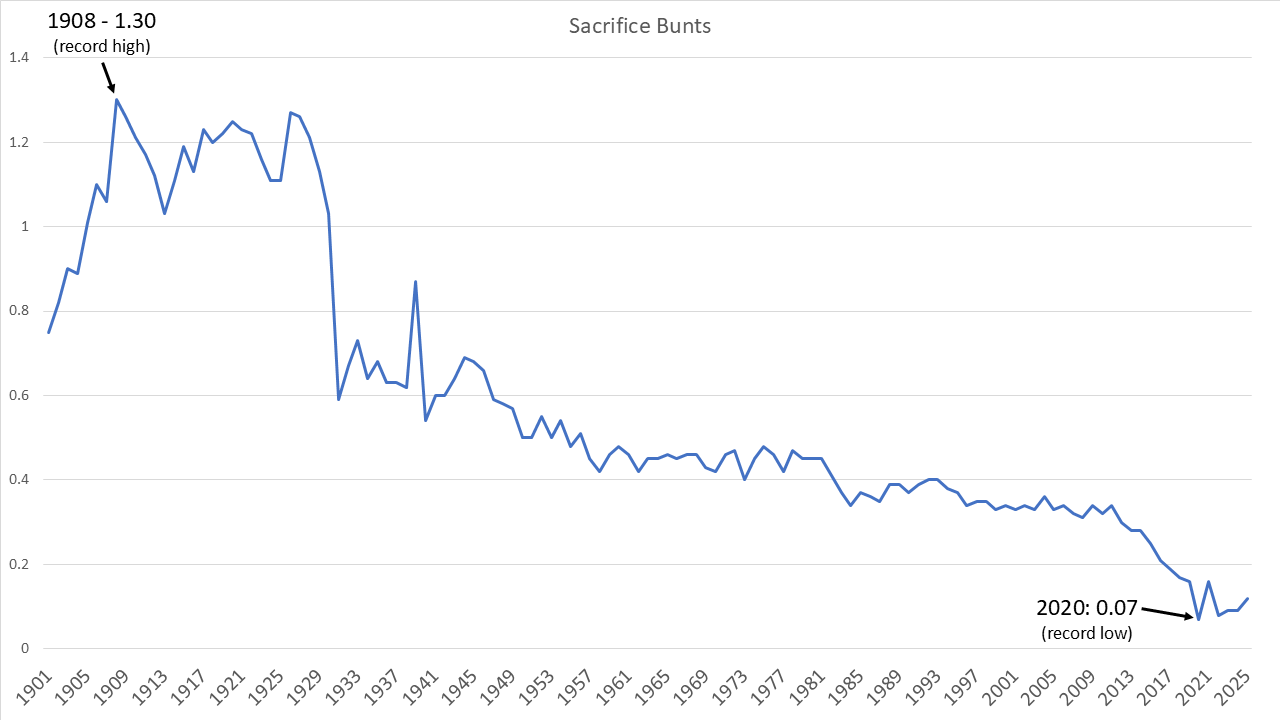
Rate of Sacrifice Bunts per team, per game, since 1901
Like triples, another part of the game that has seen a long decline is sacrifice bunts. Far more common in the early 1900s, after the rise of HRs in the 1920s and 1930s, the bunt started a long downward trend leading to a new record low of 0.07 per team, per game in the COVID-shortened 2020 season. With pitchers no longer hitting in the NL, I wouldn’t predict a change in this area for a while (if ever.)
Strikeouts
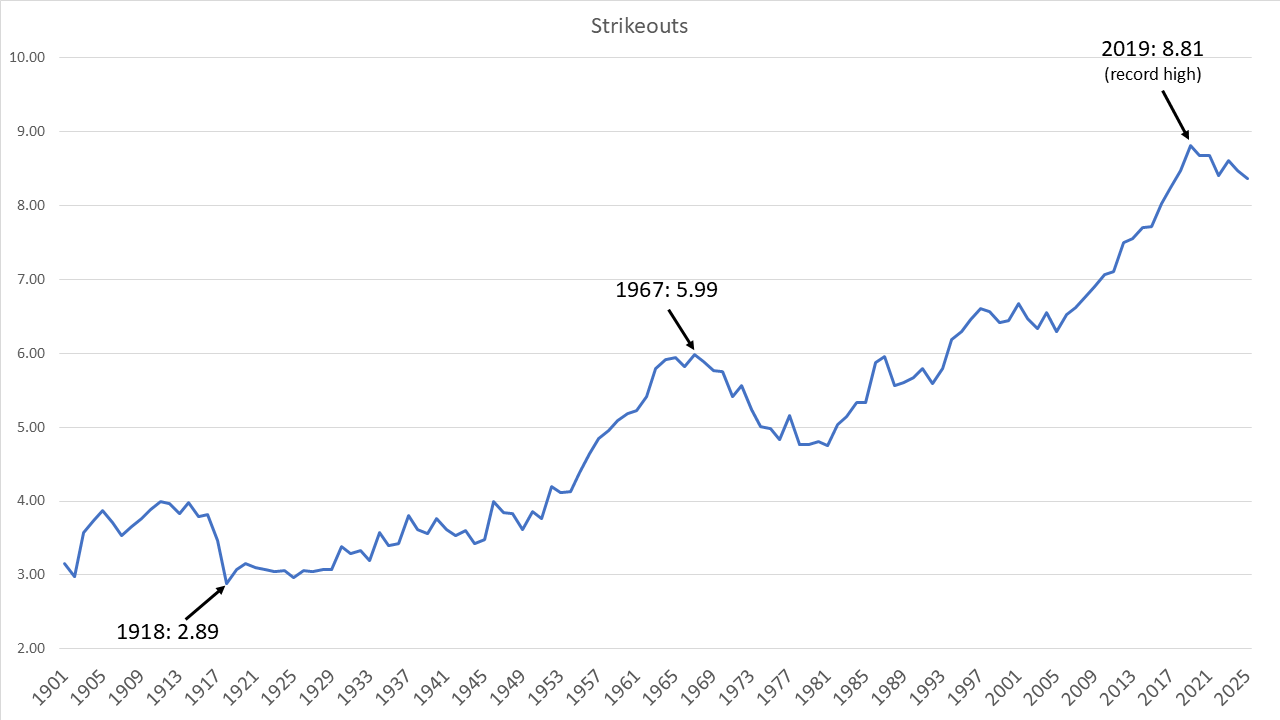
While triples and sacrifice bunts have long been trending downward, strikeouts have generally been trending up for many years. In 2025 there were 8.36 strikeouts per team, per game. That is less than the 8.48 in 2024, and actually the lowest rate since the 8.25 we had in 2017. The all-time high of 8.81 came in 2019, but the chart above shows only a slight trend downwards since then.
Complete Games
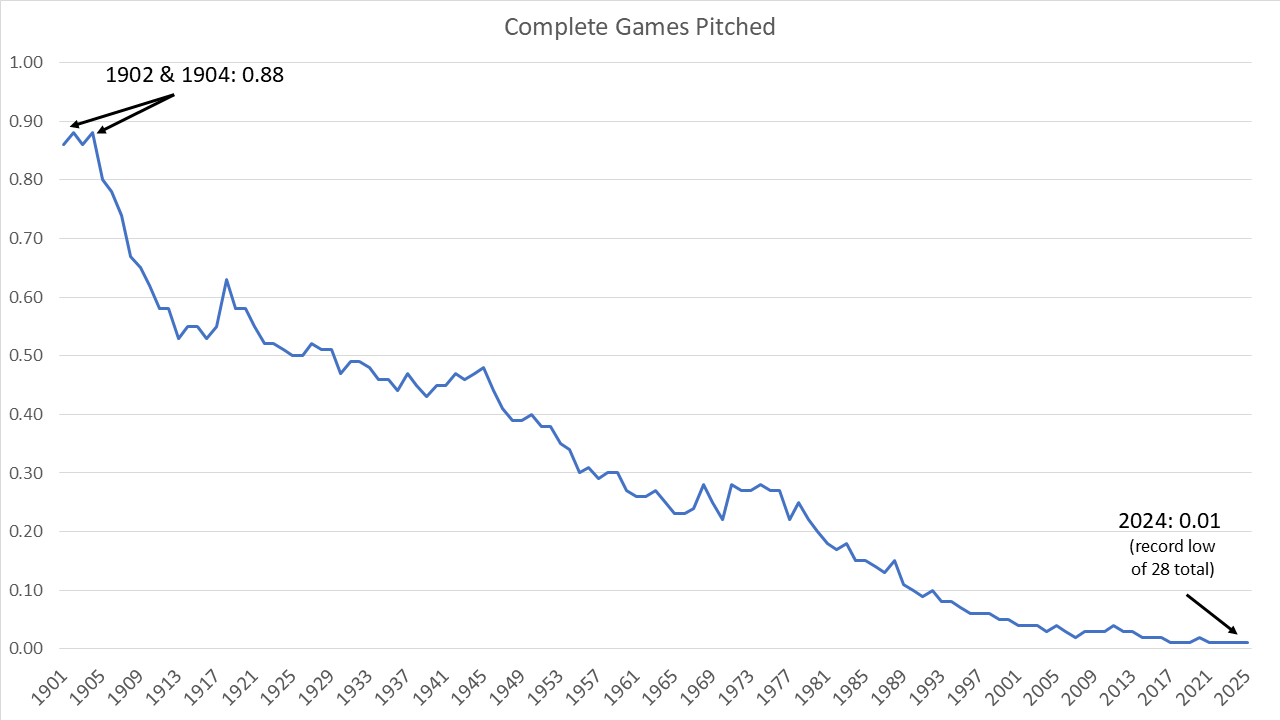
Average number of complete games pitched, per team, per game, since 1901
The increase in strikeouts has many drivers—hitters swinging for the fences, pitchers creating ever more effective pitches and mixes of pitch types, and the 50-year growth of specialized relievers who are increasingly throwing max effort with seemingly every pitch. The growth of such bullpens has also meant—for better or worse—that starting pitchers are rarely expected to go 7 or more innings, not to mention completing a game.
Indeed, 2024 set a new record for the fewest complete games in MLB history. I don’t just mean the complete game rate, which as shown above was again 0.01 per team, per game. No I mean a record for total complete games thrown—including even the very short 2020 season! In 2024 there were only 28 total complete games thrown, which was one less than the 29 in the COVID-shortened 2020 season! In 2025 pitchers across MLB only matched that total of 29.
Errors
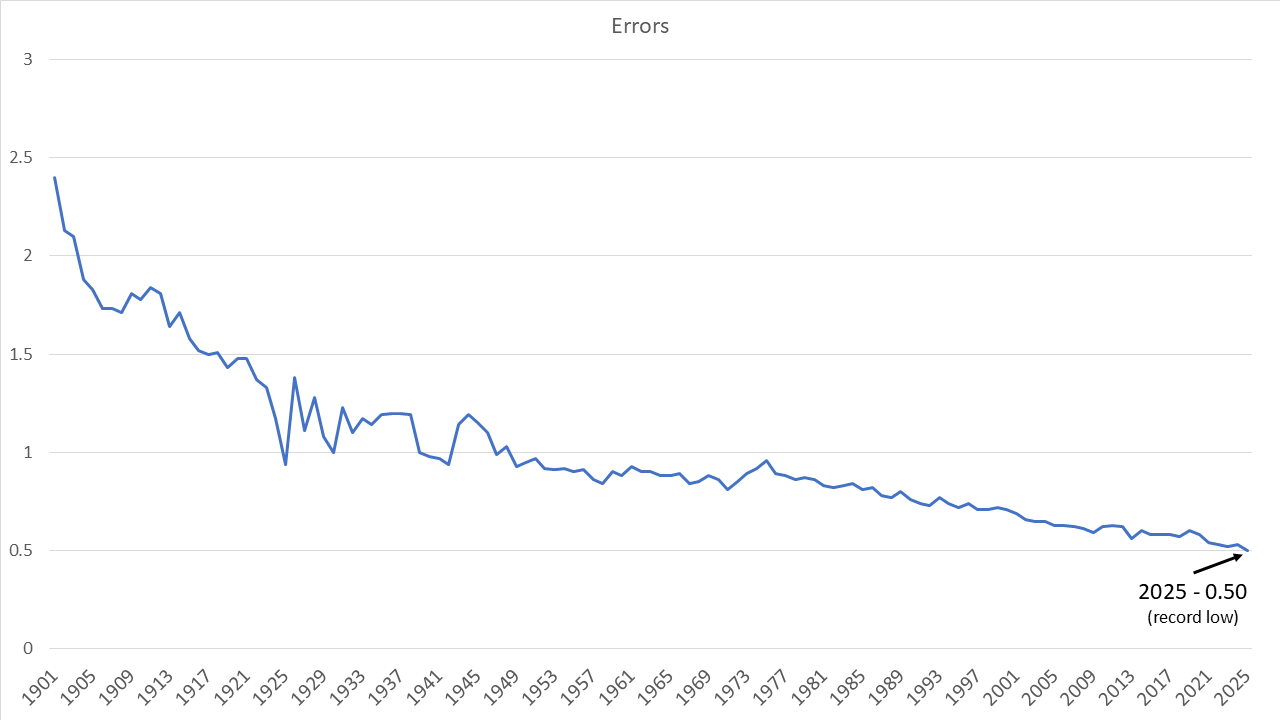
Average number of errors per team, per game, since 1901
I'm not going to delve into fielding statistics too far, but it seems worth celebrating that the rate of errors per team, per game reached a new all-time low in 2025! The rate was 0.50, which is a bit lower than the 0.52-0.53 rates from the previous three years. For comparison, that figure was 0.70 or higher every year prior 2001, and over 0.80 every year prior to 1987.
Some of this slow decline in errors is no doubt the result of ever better fielding equipment (gloves), better defensive techniques, and so on. But it is interesting to note that fielding assists are also at an all-time lows over the past several seasons, and a new record low of 8.43 assists per team, per game being the lowest ever. Are players being more conservative lately and therefore getting less assists but also committing fewer errors? Maybe. Are scoring officials, for whatever reasons, giving out fewer errors? Maybe.
But I assume the main reason that assists are lower is because of the increased focus on launch angle and hitting HRs. This leads to fewer groundballs and more flyballs—which I assume would correlate to some degree with fewer fielding assists, and also fewer errors (since more errors are committed in the infield than the outfield.)
Catcher Passed Balls
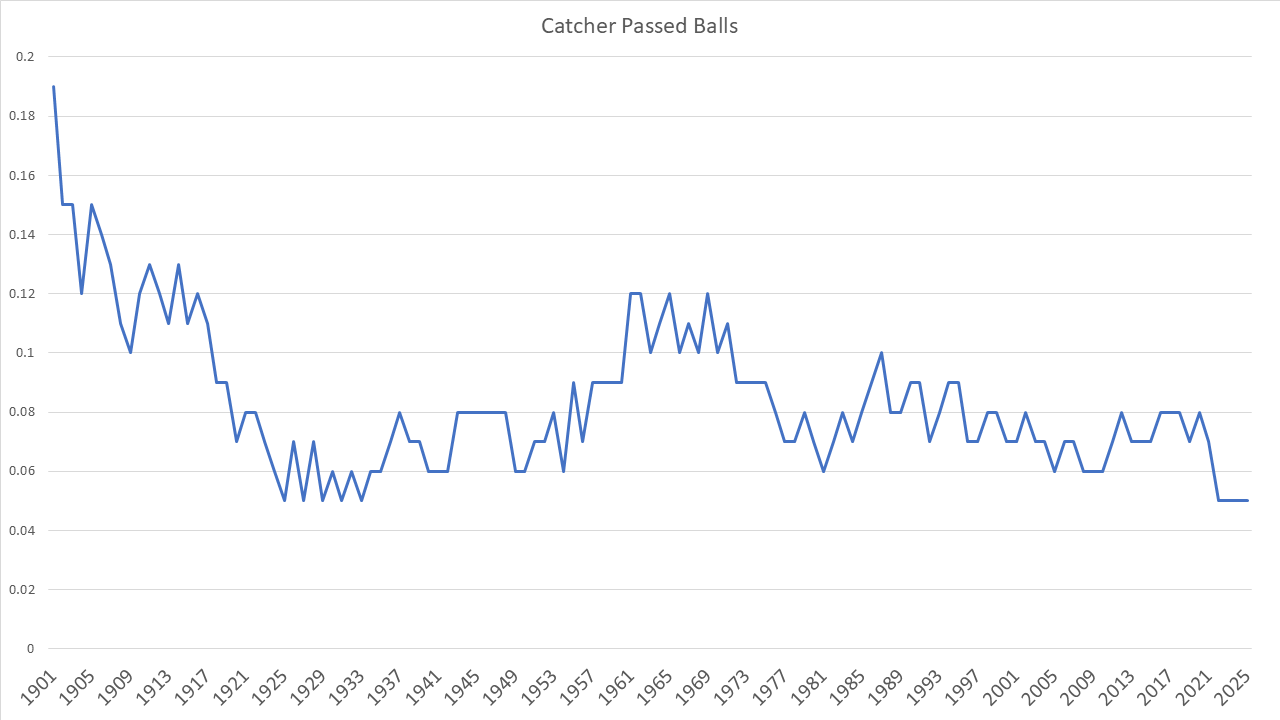
Average number of catcher passed balls, per team, per game, since 1901
Lastly... as noted earlier, catchers have hit new record lows in throwing out baserunners the past two years. Where catchers have done better is in not allowing passed balls. The rate of only 0.05 per team, per game is the same record low we saw in 2022-2024 (and also in several years from 1925-1933). What might see this change dramatically? More knuckleball pitchers!
All data is from Baseball-Reference.com.
Did you know? I wrote a 600+ page book with the same title as this newsletter/blog? Now Taking the Field: Baseball’s All-Time Dream Teams for All 30 Franchises was published in early 2019, by ACTA Sports. It is available at Amazon and most other major booksellers.

This newsletter was produced with beehiiv.
New to Now Taking the Field? Become a subscriber and get each article in your email inbox so that you don’t miss anything!